Build a simple app
A CSV is a plain-text table. Turn the practice file into a small page with a chart and one summary sentence. The AI writes the file. You check the number.
Download the practice CSV
✅ Free pending testDownload inflation.csv and leave it in your Downloads folder.
I downloaded a file named inflation.csv. Tell me how to confirm it is in my Downloads folder and that the name is exactly inflation.csv. Do not change the file.You see a file named inflation.csv in your Downloads folder.
Paste the prompt
⚠️ Free, limit: message cap pending testHTML is the code a browser shows as a page. A code block is the boxed code in the reply.
Open your AI chat. Paste this prompt into a new chat and send it.
Build me a single HTML file I can open in my browser. No installs, no server.

It should:
1. Let me pick a CSV file from my computer.
2. Read the first column as the country name. The other columns are years with numbers.
3. Show a dropdown of the countries.
4. When I pick a country, draw a line chart of its numbers by year. Use Chart.js from a CDN.
5. Under the chart, write one sentence: the highest value, the year it happened, and the change from the first year to the last year.
6. Look clean and simple, and work on a phone.

Give me the whole file in one code block so I can save it as index.html.
You see one code block that starts with <!DOCTYPE html> and ends with </html>.
Save the reply as index.html
✅ Free pending testCopy the code only. Leave out the chat text. A backtick is the key just left of 1. Leave out any line that is only backticks. Those lines sit above and below the code.
- Mac: open TextEdit, create a document, then choose Format > Make Plain Text.
- Windows: open Notepad. When saving, choose Save as type: All files.
- Paste the code and save it as
index.html. The name must not beindex.html.txt.
I am using [Mac TextEdit / Windows Notepad]. Walk me through saving your code as index.html, with no .txt ending. Keep the steps short. Do not change the code.You see a file named index.html in the folder where you saved it.
Open it in your browser
✅ Free pending testDouble-click index.html.
Select inflation.csv, then select Laos.
Stay online. The page draws the chart with code from the internet.
In the file, the Laos value for 2023 is 31.230144. A sentence that says 31.23 is the same value rounded to two decimal places.
The Laos row in inflation.csv has its highest value in 2023. That cell is 31.230144. Tell me how to check that my chart and the sentence under it match that cell. Treat 31.23 as a match if the sentence rounds to two decimal places.
You see Laos selected, a line that peaks at 31.23 in 2023, and a sentence under the chart that states that peak.
Same prompt, two AIs, two apps
We pasted the prompt above, unchanged, into Grok and into Codex. Both apps worked. Yours can look different. Accept 31.23 or 31.230144. Both match the Laos cell for 2023.
Grok
You see the heading Country chart, Laos selected, and a sentence that says 31.23 in 2023.
Codex
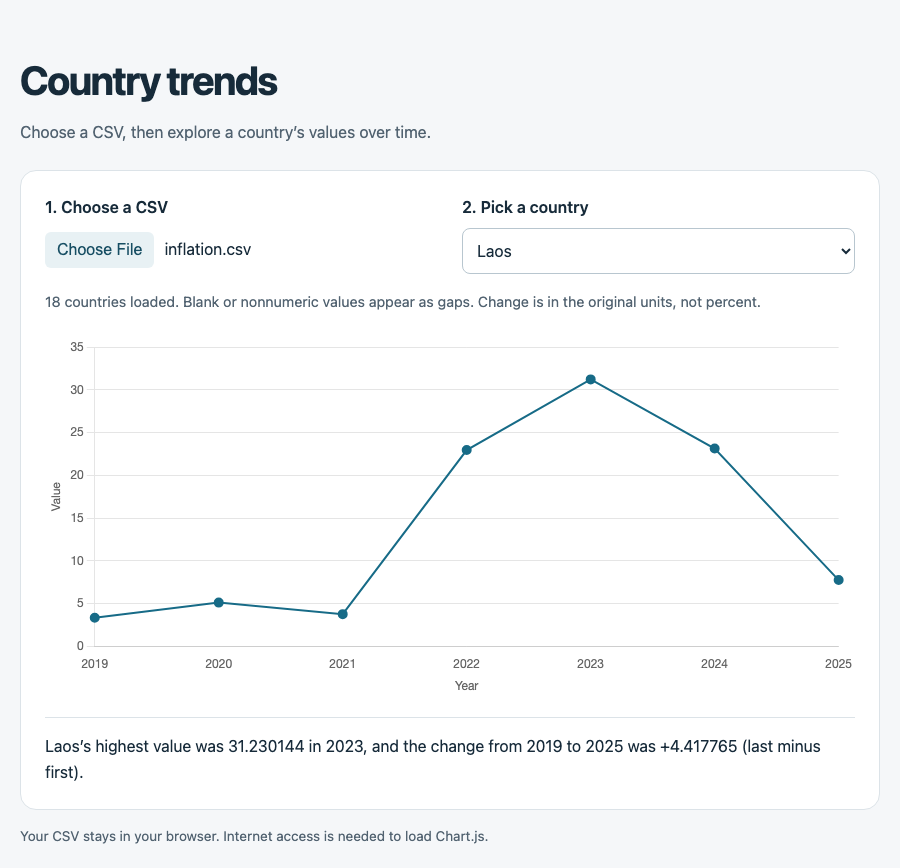
You see the heading Country trends, Laos selected, and a sentence that says 31.230144 in 2023.
If it does not work
⚠️ Free, limit: message cap pending testRight-click the page, choose Inspect, then open Console.
Copy any red text. Paste this prompt into the same chat.
I opened index.html and [describe what you see]. Here is the red error text, if any: [paste the red text]. Fix the file and return the whole index.html in one code block.Replace the old code with the new file. Save. Refresh the browser. Select inflation.csv and Laos again.
You see a Laos line chart and a sentence that gives the 2023 peak as 31.23 or 31.230144.
Make it yours
⚠️ Free, limit: message cap pending testPaste one prompt into the same chat. Save the new file, refresh, and check the page before you send another.
Let me compare two countries on one chart. Label each line with the country name. Give me the whole updated index.html.Add a table under the chart with the selected country’s years and values. Give me the whole updated index.html.Colour each line by group, ASEAN or G7. Add a legend, which is a note that names each colour. If the CSV has no group column, ask me which countries belong to each group before you write the file. Give me the whole updated index.html.After you refresh, you see the one change you asked for: two labelled lines, a table of years and values, or a colour note for ASEAN and G7.
Publish it
✅ Free pending testNetlify Drop and GitHub Pages put a file on the public web for free.
Follow one publishing option on Build your own website. Publish this index.html.
A visitor selects their own CSV. Then open your public link, select inflation.csv, and select Laos.
I have an index.html file that lets a visitor select a CSV. Help me follow the publishing steps for [Netlify Drop / GitHub Pages]. I am at this point: [the step I am on, or the message I see]. Tell me the next click. I am using a free account and the website only.You see your page at a public link that starts with https, and the Laos line peaks in 2023.